Cancitis – an abbreviation of Cancer and the Latin word itis for inflammation - is part of the National Center for Mathematical Modeling - Human Health and Disease (COMMAND) at RUC. The Center for Mathematical Modeling - Health and Disease collaborates with the PandemiX Center, Center for Big Data and Center for Sundhedsfremmeforskning at RUC.
Nationally we have a well established collaboration with Hospitals in Region Copenhagen and in particular Dept. of Hematology, Region Zealand, Roskilde. The collaboration includes co-financed PhD students/postdocs focusing on educating and recruiting young researchers. We are member of the Danish Life Science Cluster “Center for (Early) Diagnosis and Treatment/Clinical Health Data Science” and Key member of the Greater Copenhagen CAG (Clinical Academic Group) initiative “ZIRI: The Zealand Inflammation Research Initiative. Chronic Inflammation, Vascular Diseases, and Cancer. Mutations in Blood Cells - a Common Link?”.
The Cancitis group and the Center for Mathematical Modeling - Health and Disease at RUC host a recent Lundbeck-Foundation’s Fellowship led by Prof. Thomas Stiehl. The Fellowship project on “Mathematical modeling of Acute Leukemia” (2021-2025) is a five-year and 10 Mill DKK grant in collaboration with Zealand University Hospital, Department of Hematology. The team members have successfully been investigating ways to work with Region Zealand and Region Copenhagen blood bank data and the Statens Serum Institute to create a brand new natural observatory for disease protection (antibodies, mutations, etc.) in Danish population age cohorts.
 RUC Research Profile.
DOI: 10.1038/s41408-024-00994-z
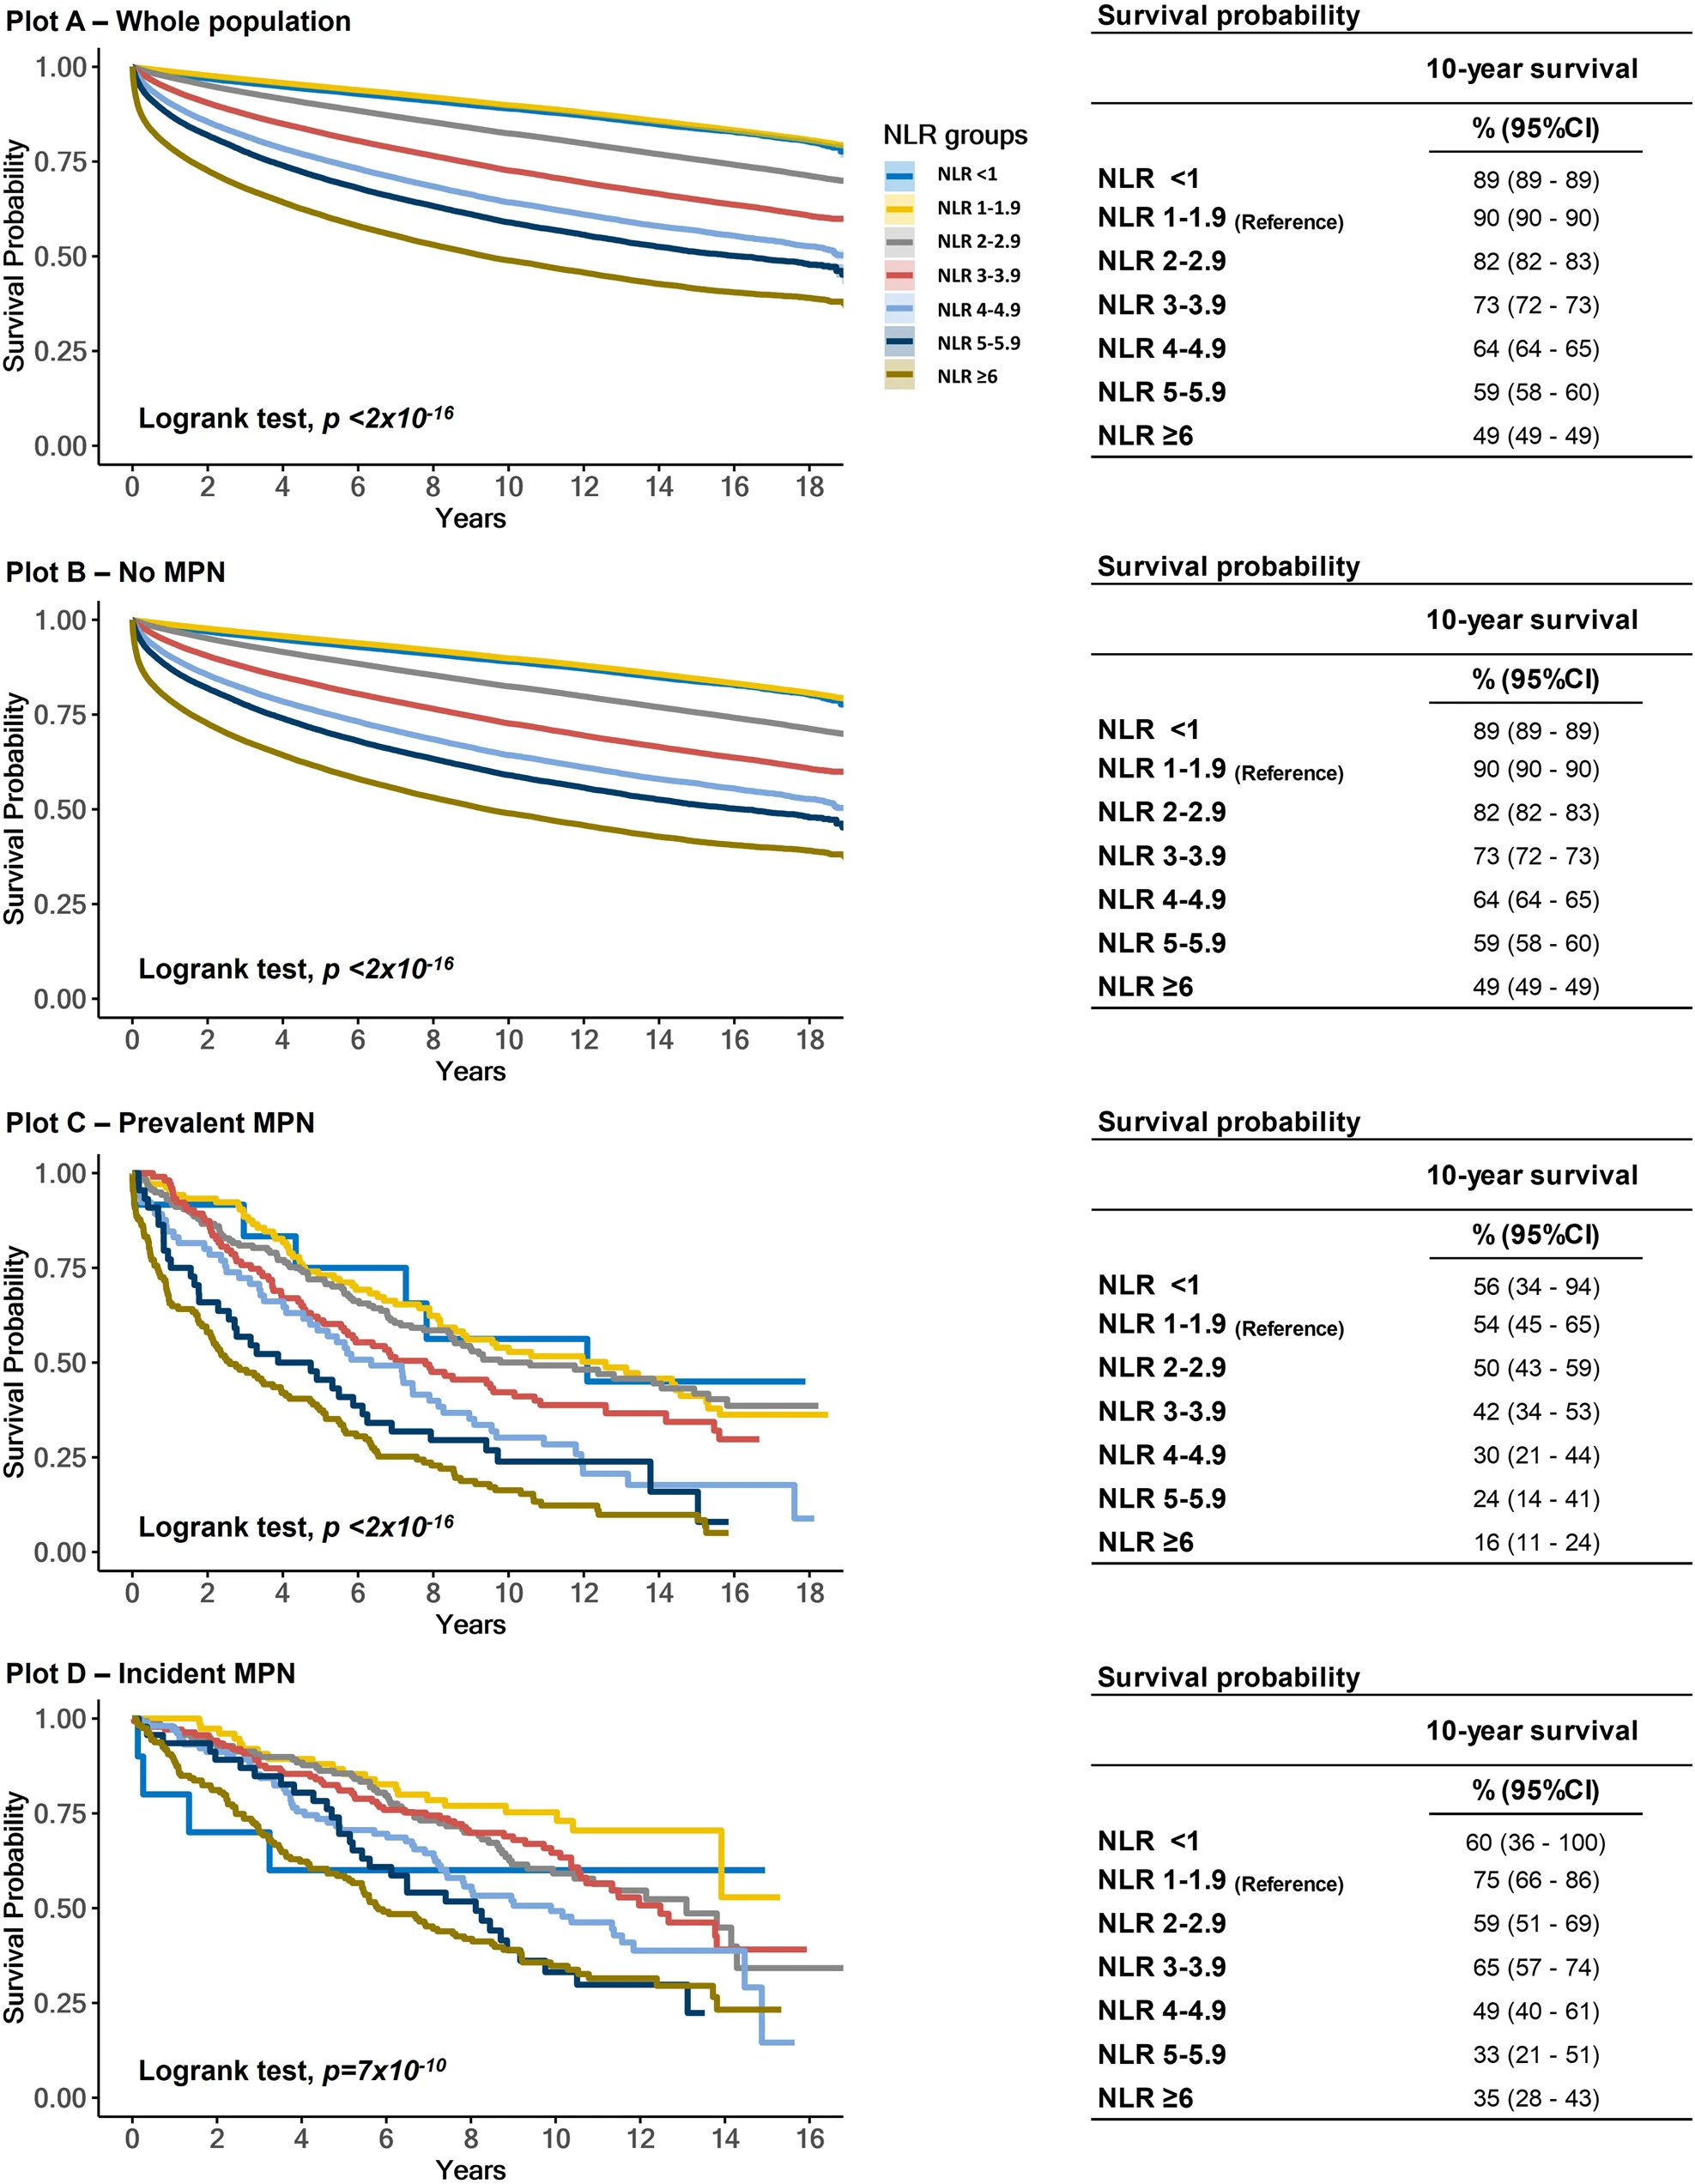
Morten Kranker Larsen, Vibe Skov, Lasse Kjær, Christina Schjellerup Eickhardt-Dalbøge, Trine Alma Knudsen, Marie Hvelplund Kristiansen, Anders Lindholm Sørensen, Troels Wienecke, Morten Andersen, Johnny T. Ottesen, Johanne Gudmand-Høyer, Jordan Andrew Snyder, Mikkel Porsborg Andersen, Christian Torp-Pedersen, Henrik Enghusen Poulsen, Thomas Stiehl, Hans Carl Hasselbalch, Christina Ellervik
Link to journal
DOI: 10.3389/fimmu.2024.1384509
Tobias Idor Boklund, Jordan Snyder, Johanne Gudmand-Hoeyer, Morten Kranker Larsen, Trine Alma Knudsen, Christina Schjellerup Eickhardt-Dalbøge, Vibe Skov, Lasse Kjær, Hans C. Hasselbalch, Morten Andersen, Johnny T. Ottesen and Thomas Stiehl
Link to journal
Johnny T. Ottesen and Morten Andersen
Link to journal
DOI: 10.3389/fimmu.2023.1240678
Morten Orebo Holmström, Morten Andersen, Sofie Traynor, Shamaila Munir Ahmad, Thomas Landkildehus Lisle, Jacob Handlos Grauslund, Vibe Skov, Lasse Kjær, Johnny T. Ottesen, Morten Frier Gjerstorff, Hans Carl Hasselbalch, and Mads Hald Andersen
Link to journal
DOI: 10.1051/mmnp/2023007
Bjarke Spangsberg Bak, Morten Andersen, Johnny T. Ottesen and J.S. Hansen
Link to journal
DOI: 10.3389/fonc.2023.1176173
Lasse Kjær, Vibe Skov, Morten Kranker Larsen, Tobias Idor Boklund, Morten Andersen, Maria Kefala, Trine A. Knudsen, Christina Schjellerup Eickhardt-Dalbøge, Thomas Stiehl, Johanne Gudmand-Høyer, Jordan Snyder, Morten Holmström, Mads H. Andersen, Johnny T. Ottesen, Christina Ellervik, and Hans C. Hasselbalch
Link to journal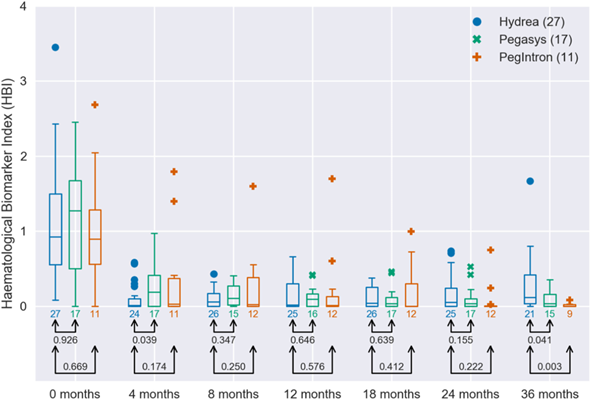
DOI: 10.1002/cam4.5285
Marc J. B. Dam, Rasmus K. Pedersen, Trine A. Knudsen, Morten Andersen, Christina Ellervik, Morten Kranker Larsen, Lasse Kjær, Vibe Skov, Hans C. Hasselbalch, and Johnny T. Ottesen
Link to journal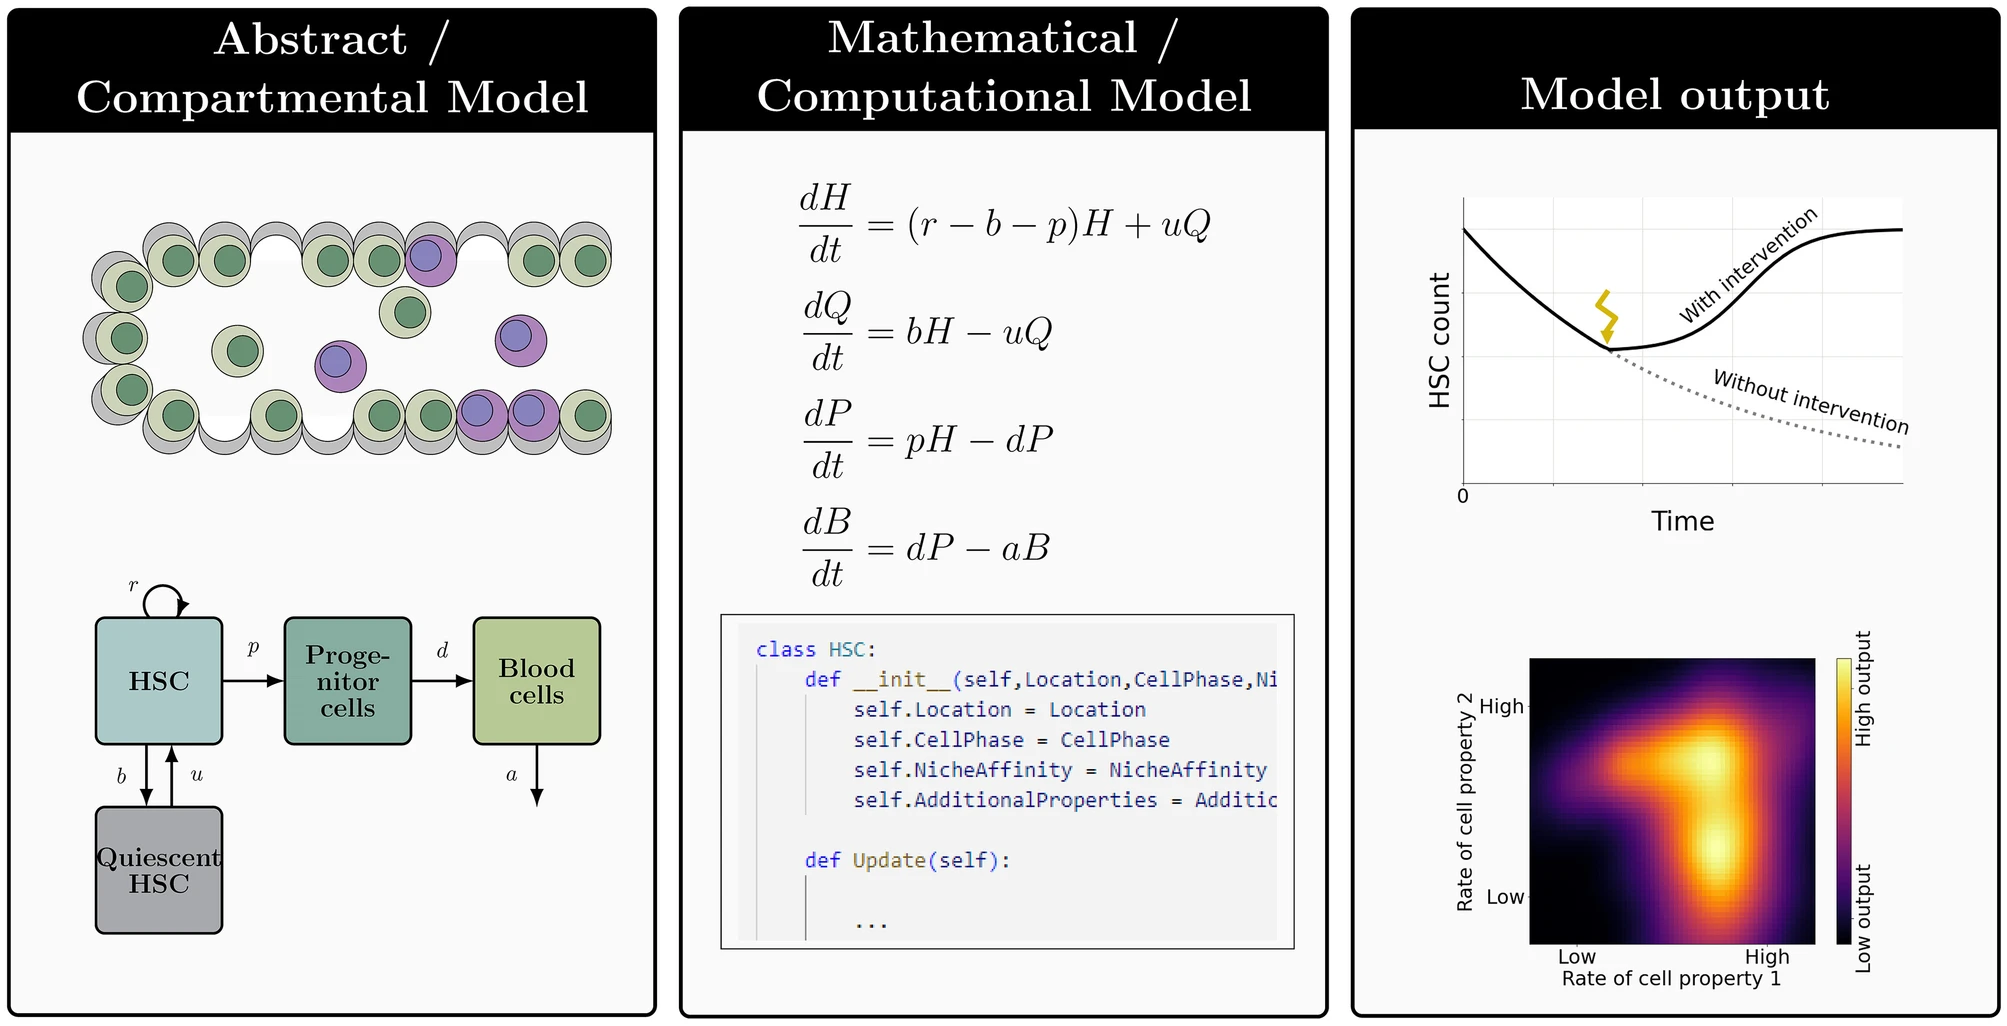
DOI: 10.1007/s40778-023-00224-5
Rasmus K. Pedersen, Morten Andersen, Thomas Stiehl, and Johnny T. Ottesen
Link to journal
Rasmus Kristoffer Pedersen, Morten Andersen, Vibe Skov, Lasse Kjær, Hans C Hasselbalch, Johnny T Ottesen, and Thomas Stiehl
Link to journal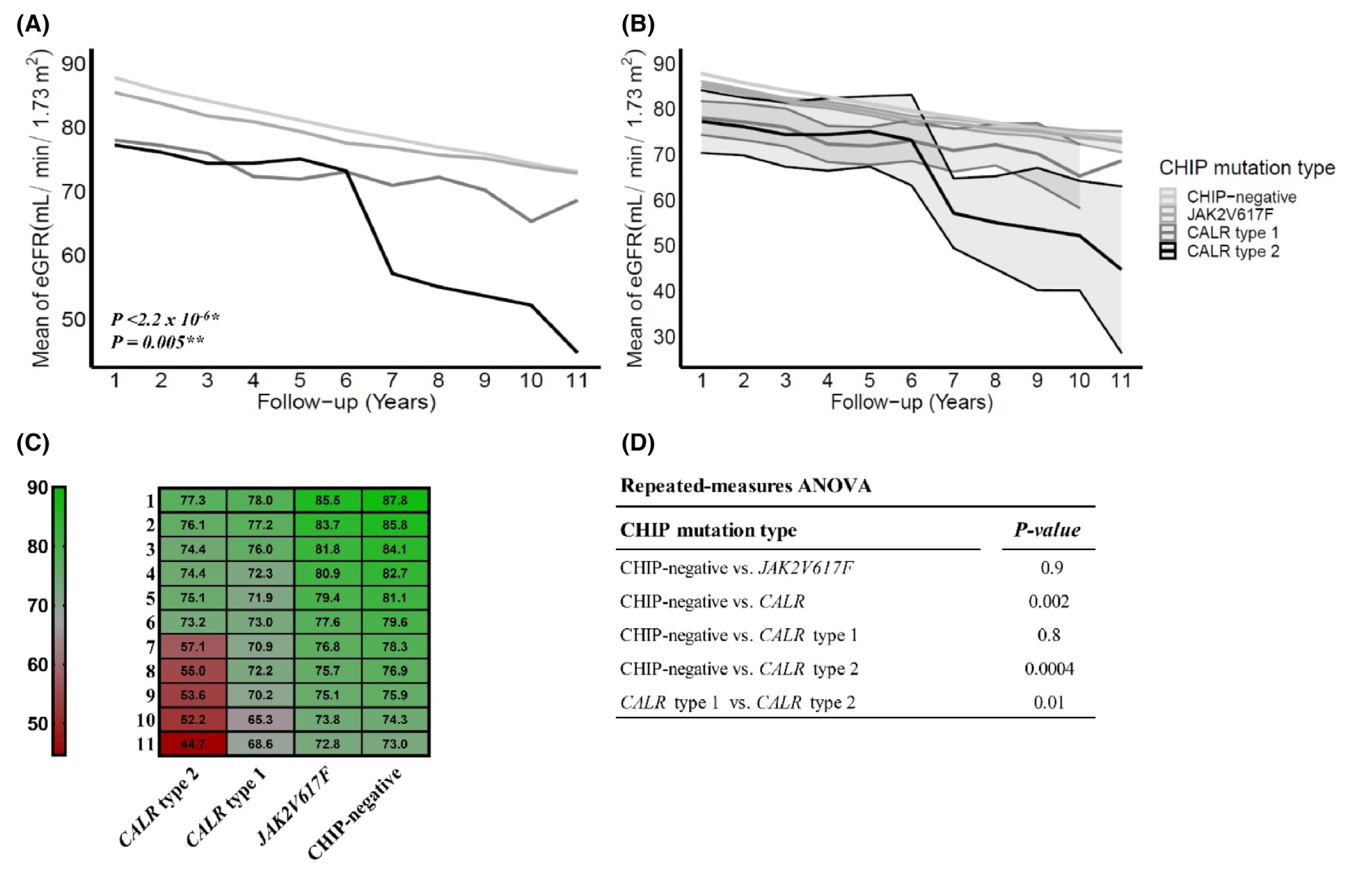
DOI: 10.1111/ejh.13845
Morten K. Larsen, Vibe Skov, Lasse Kjær, Natascha A. Møller-Palacino, Rasmus K. Pedersen, Morten Andersen, Johnny T. Ottesen, Sabrina Cordua, Henrik E. Poulsen, Morten Dahl, Trine A. Knudsen, Christina Schjellerup Eickhardt-Dalbøge, Steffen Koschmieder, Kasper M. Pedersen, Yunus Çolak, Stig E. Bojesen, Børge G. Nordestgaard, Thomas Stiehl, Hans C. Hasselbalch, Christina Ellervik
Link to journal
DOI: 10.1182/blood-2022-165252
Morten Kranker Kranker Larsen, Vibe Skov, Lasse Kjær, Henrik E. Poulsen, Christina S. Eickhardt-Dalbøge, Trine A. Knudsen, Sarah F. Christensen, Anders L. Sørensen, Marie H. Kristiansen, Troels Wienecke, Rasmus K. Pedersen, Morten Andersen, Johnny T. Ottesen, Thomas Stiehl, Christina Ellervik, and Hans Carl Hasselbalch
Link to journal
Johnny T. Ottesen and Morten Andersen
Link to journal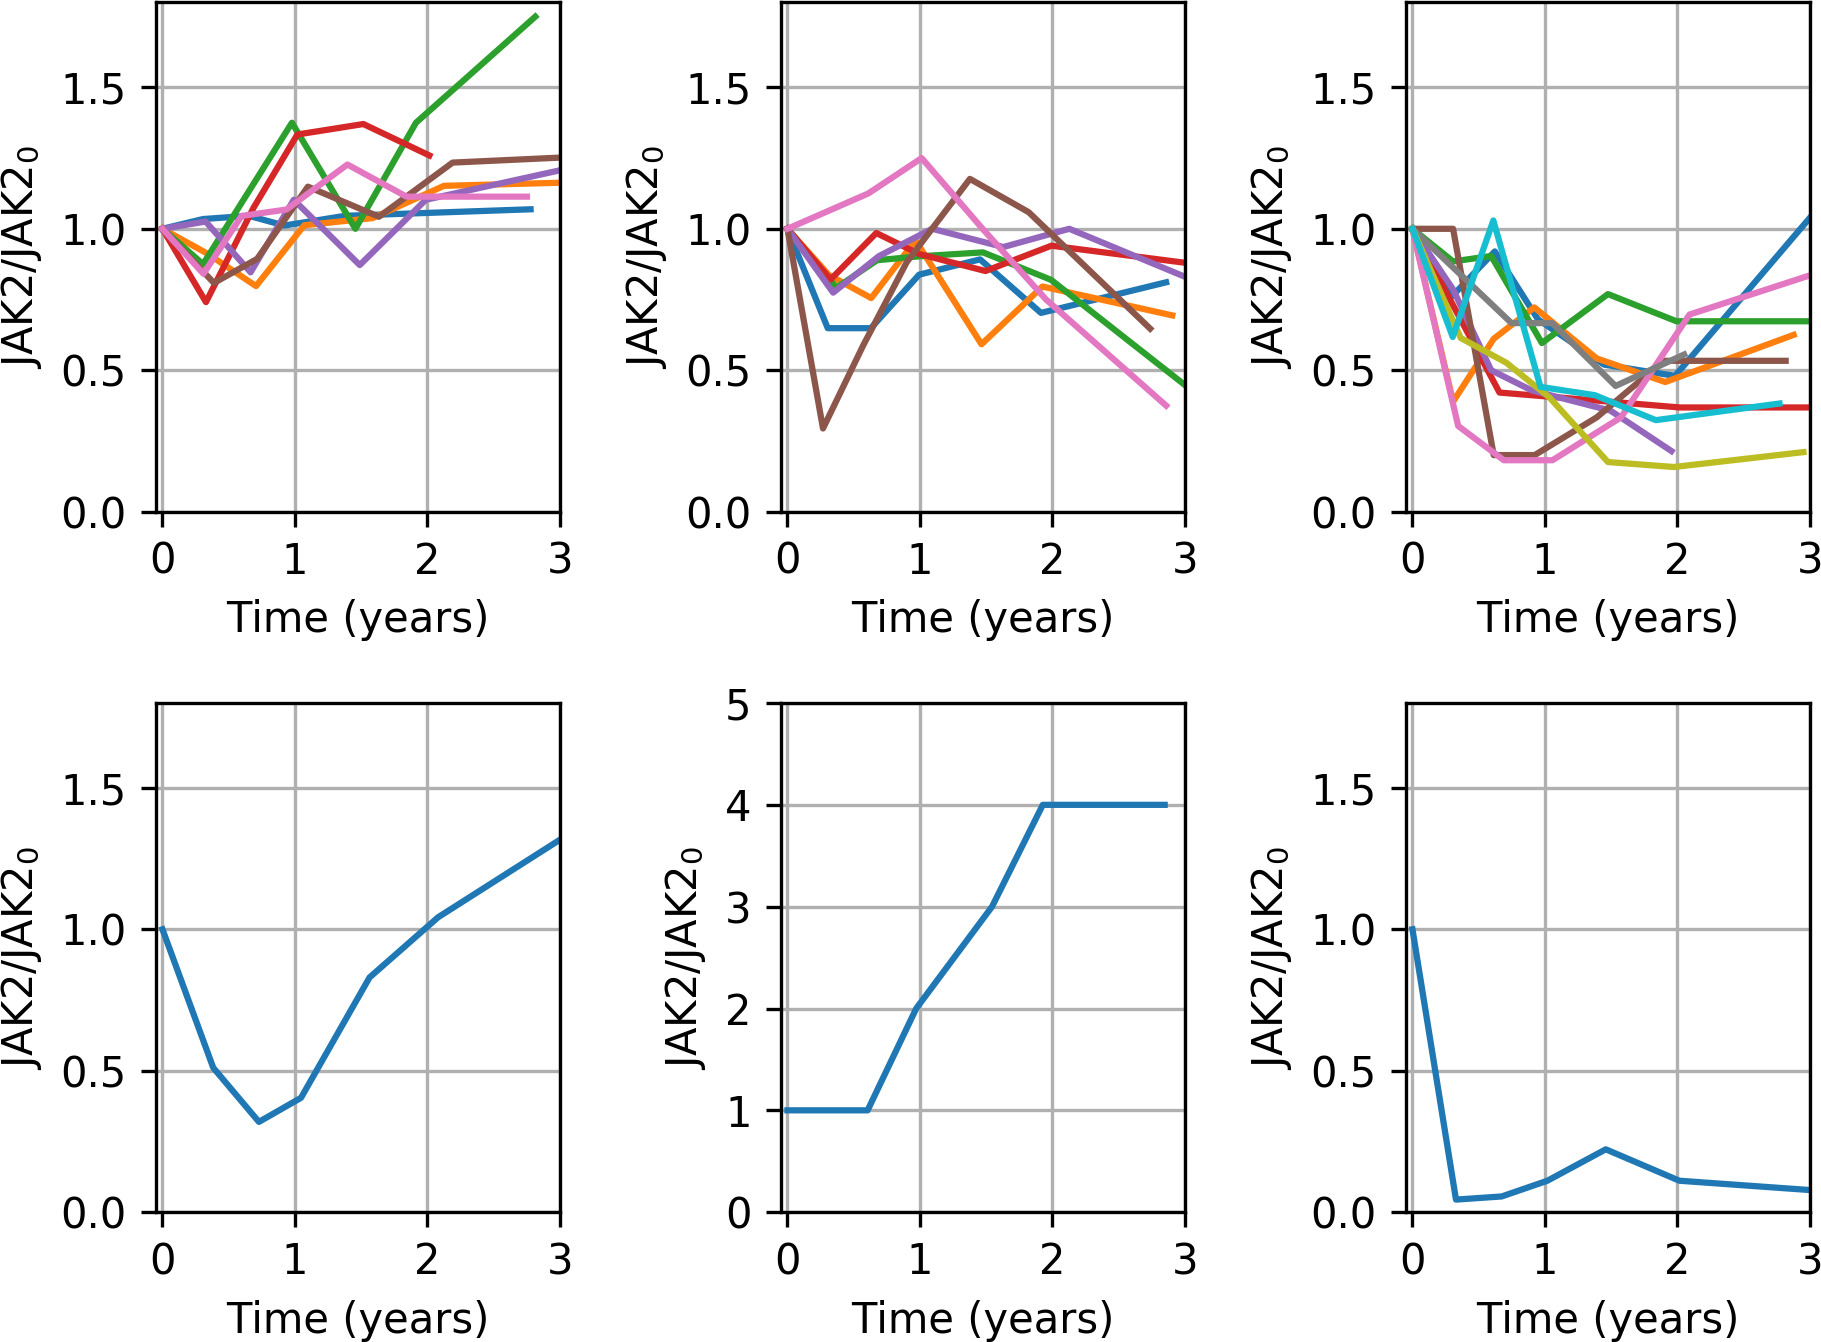
DOI: 10.1111/ejh.13700
Marc J. B. Dam, Rasmus K. Pedersen, Trine A. Knudsen, Morten Andersen, Vibe Skov, Lasse Kjær, Hans C. Hasselbalch, and Johnny T. Ottesen
Link to journal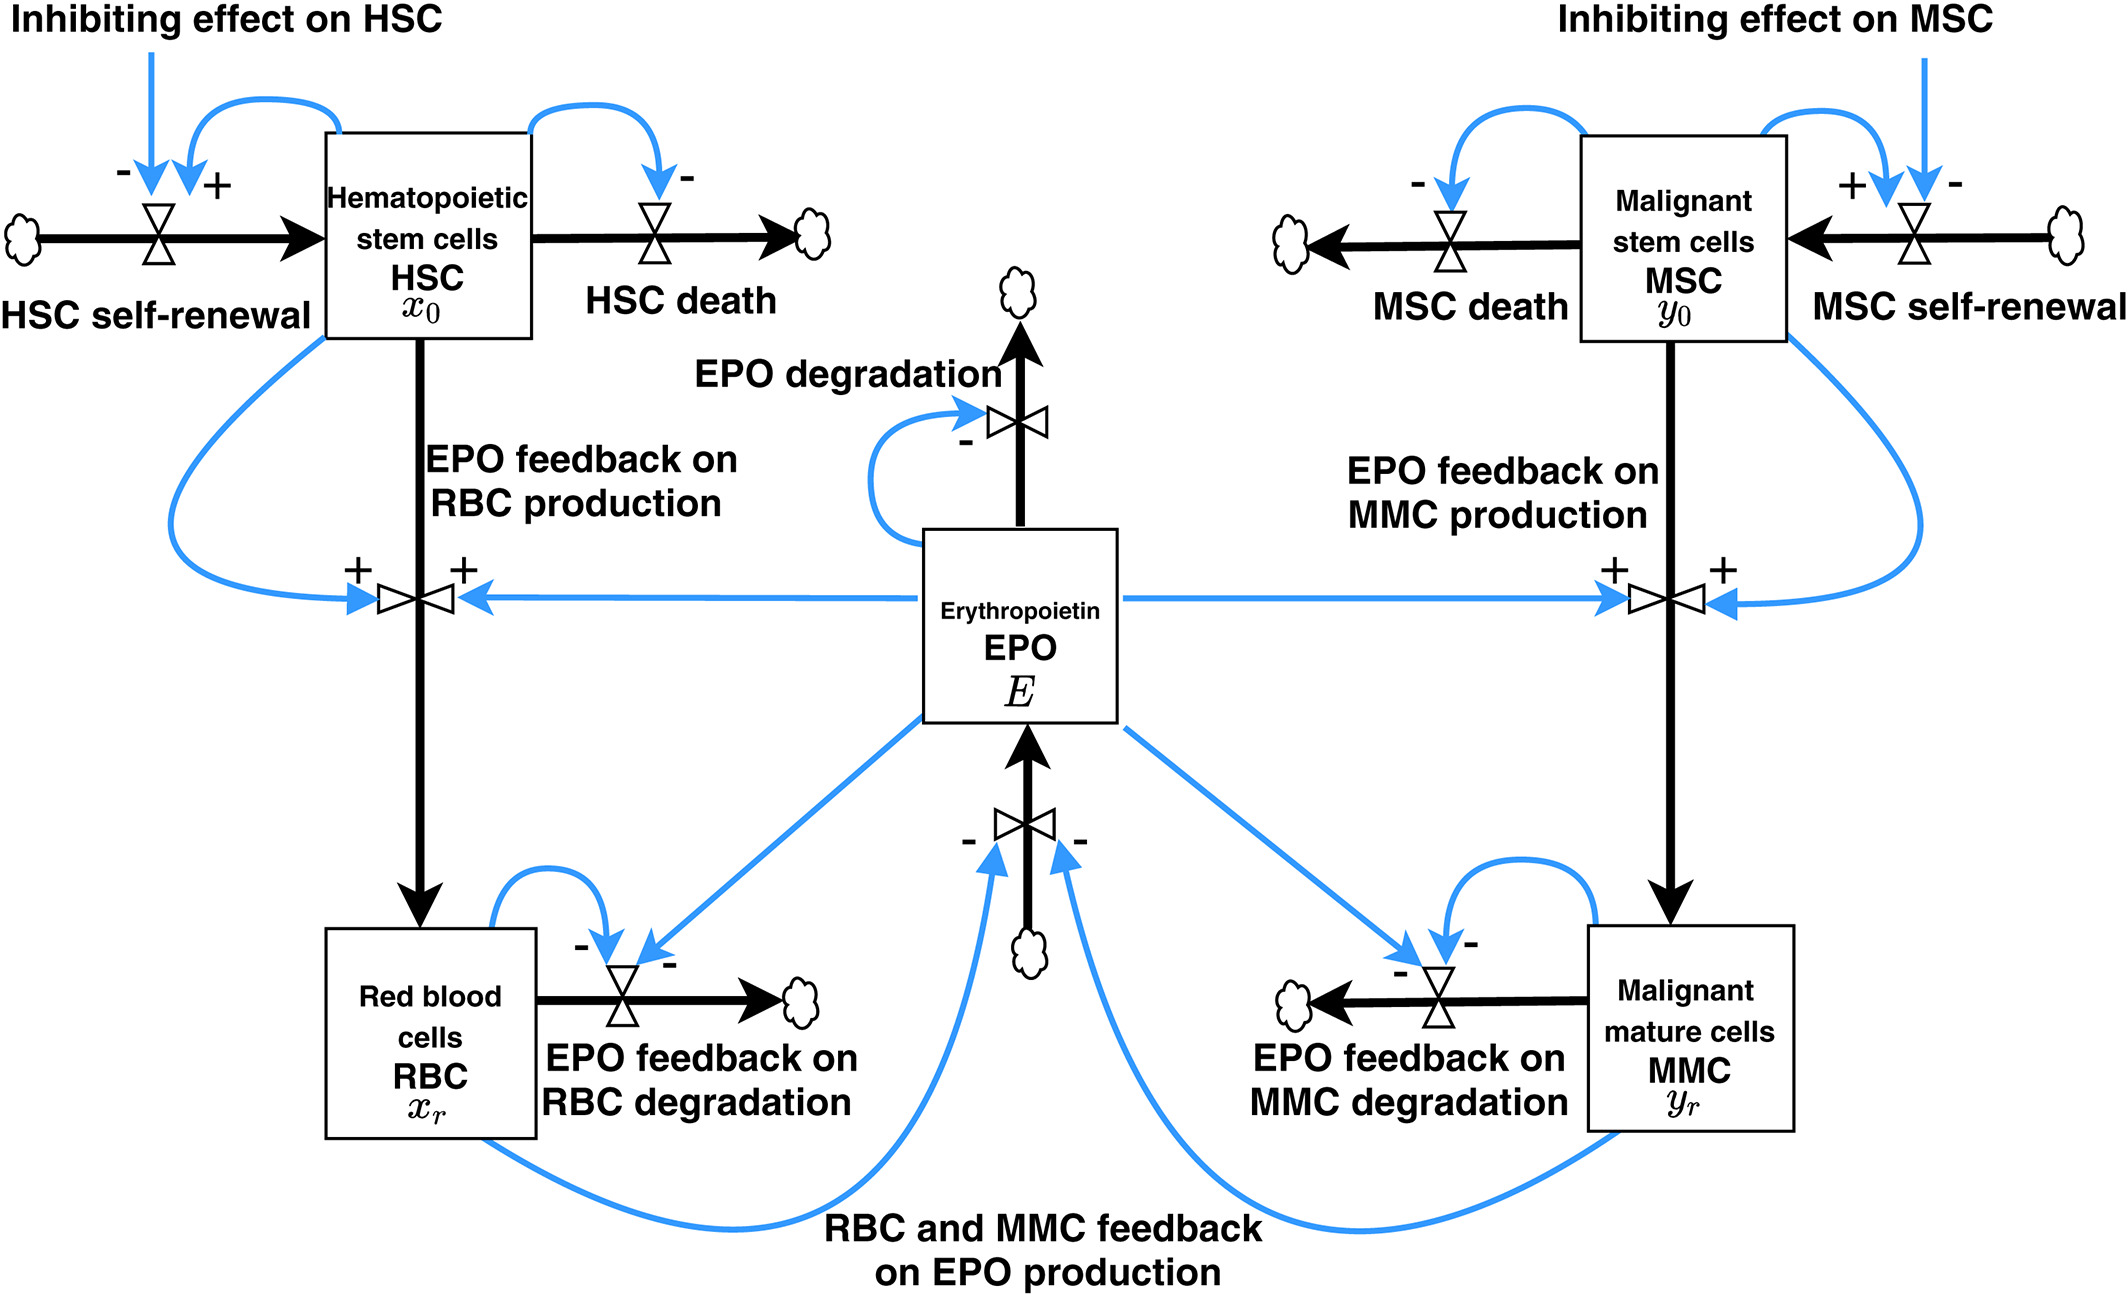
DOI: 10.1002/sdr.1670
Zamra Sajid, Morten Andersen and Johnny T. Ottesen
Link to journal
DOI: 10.1016/j.jtbi.2021.110620
Rasmus Kristoffer Pedersen, Morten Andersen, Thomas Stiehl and Johnny T. Ottesen
Link to journal
DOI: 10.1016/B978-0-12-801238-3.11510-7
Johnny T. Ottesen, Thomas Stiehl, and Morten Andersen
Link to journal
DOI: 10.3934/mbe.2020389
Katrine O. Bangsgaard, Morten Andersen, Vibe Skov, Lasse Kjær, Hans C. Hasselbalch and Johnny T. Ottesen
Link to journal View PDF
DOI: 10.1016/j.mbs.2020.108372
Morten Andersen, Hans C. Hasselbalch, Lasse Kjær, Vibe Skov and Johnny T. Ottesen
Link to journal View PDF
DOI: 10.1002/cam4.2741
Rasmus K. Pedersen, Morten Andersen, Trine A. Knudsen, Zamra Sajid, Johanne Gudmand-Hoeyer, Marc J. B. Dam, Vibe Skov, Lasse Kjær, Christina Ellervik, Thomas S. Larsen, Dennis Hansen, Niels Pallisgaard, Hans C. Hasselbalch and Johnny T. Ottesen
Link to journal View PDF View supplementary material
DOI: 10.3934/mbe.2019418
Zamra Sajid, Morten Andersen and Johnny T. Ottesen
Link to journal View PDF
DOI: 10.1016/j.jtbi.2019.01.001
Johnny T. Ottesen, Rasmus K. Pedersen, Zamra Sajid, Johanne Gudmand-Høyer, Katrine O. Bangsgaard, Vibe Skov, Lasse Kjær, Trine A. Knudsen, Niels Pallisgaard, Hans C. Hasselbalch, and Morten Andersen
Link to journal View PDF Additional info and figuresDOI: 10.1182/blood-2019-126819
Vibe Skov, Marc JB Dam, Rasmus K Pedersen, Morten Andersen, Trine Alma Knudsen, Zamra Sajid, Lasse Kjær PhD, Christina Ellervik, Hans Hasselbalch, and Johnny T Ottesen
Link to journal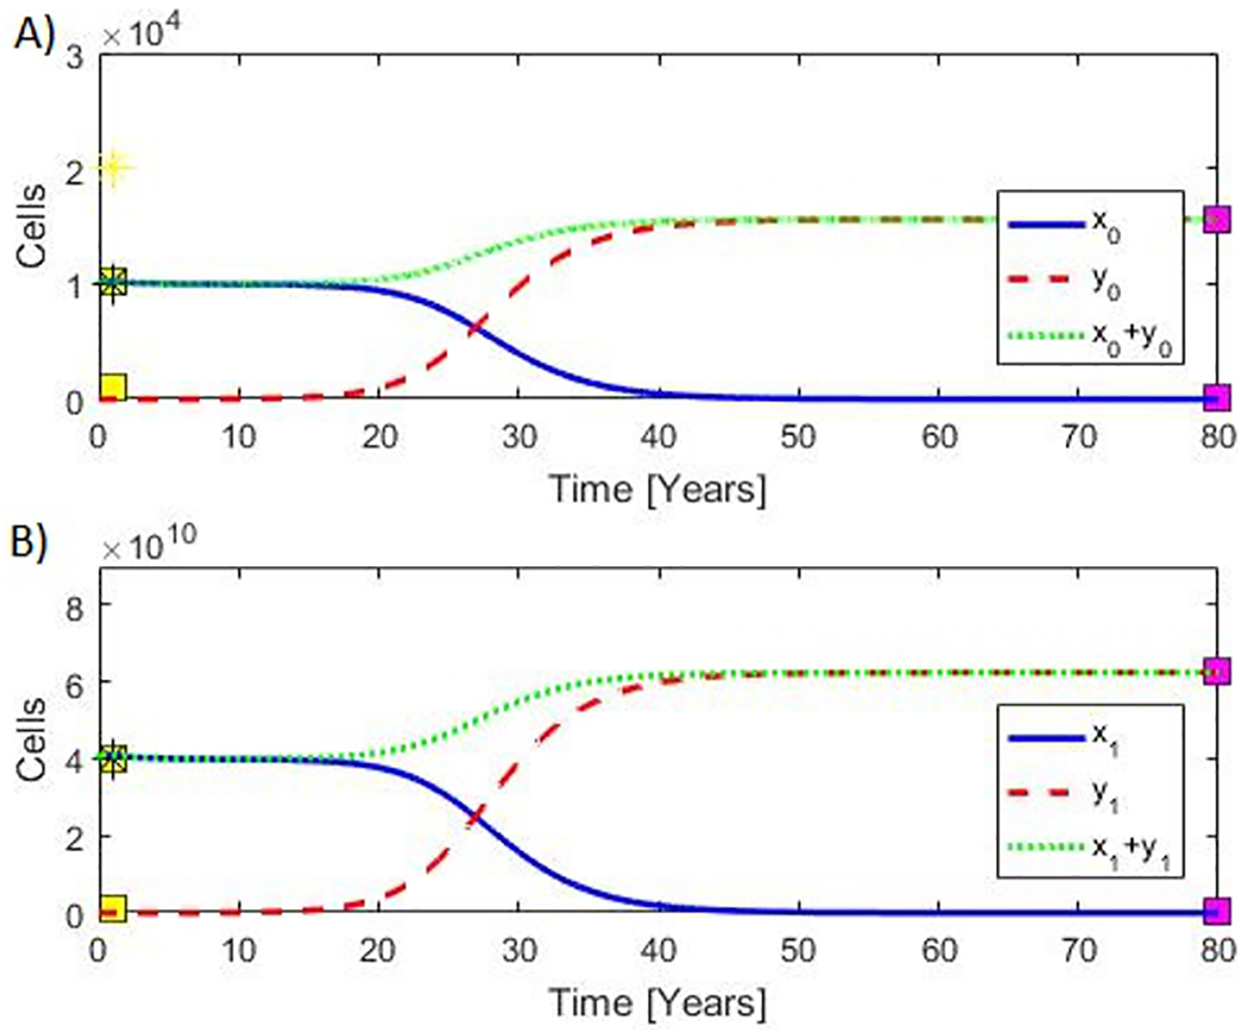
DOI: 10.1371/journal.pone.0183620
Morten Andersen, Zamra Sajid, Rasmus K. Pedersen, Johanne Gudmand-Hoeyer, Christina Ellervik, Vibe Skov, Lasse Kjær, Niels Pallisgaard, Torben A. Kruse, Mads Thomassen, Jesper Troelsen, Hans Carl Hasselbalch, Johnny T. Ottesen
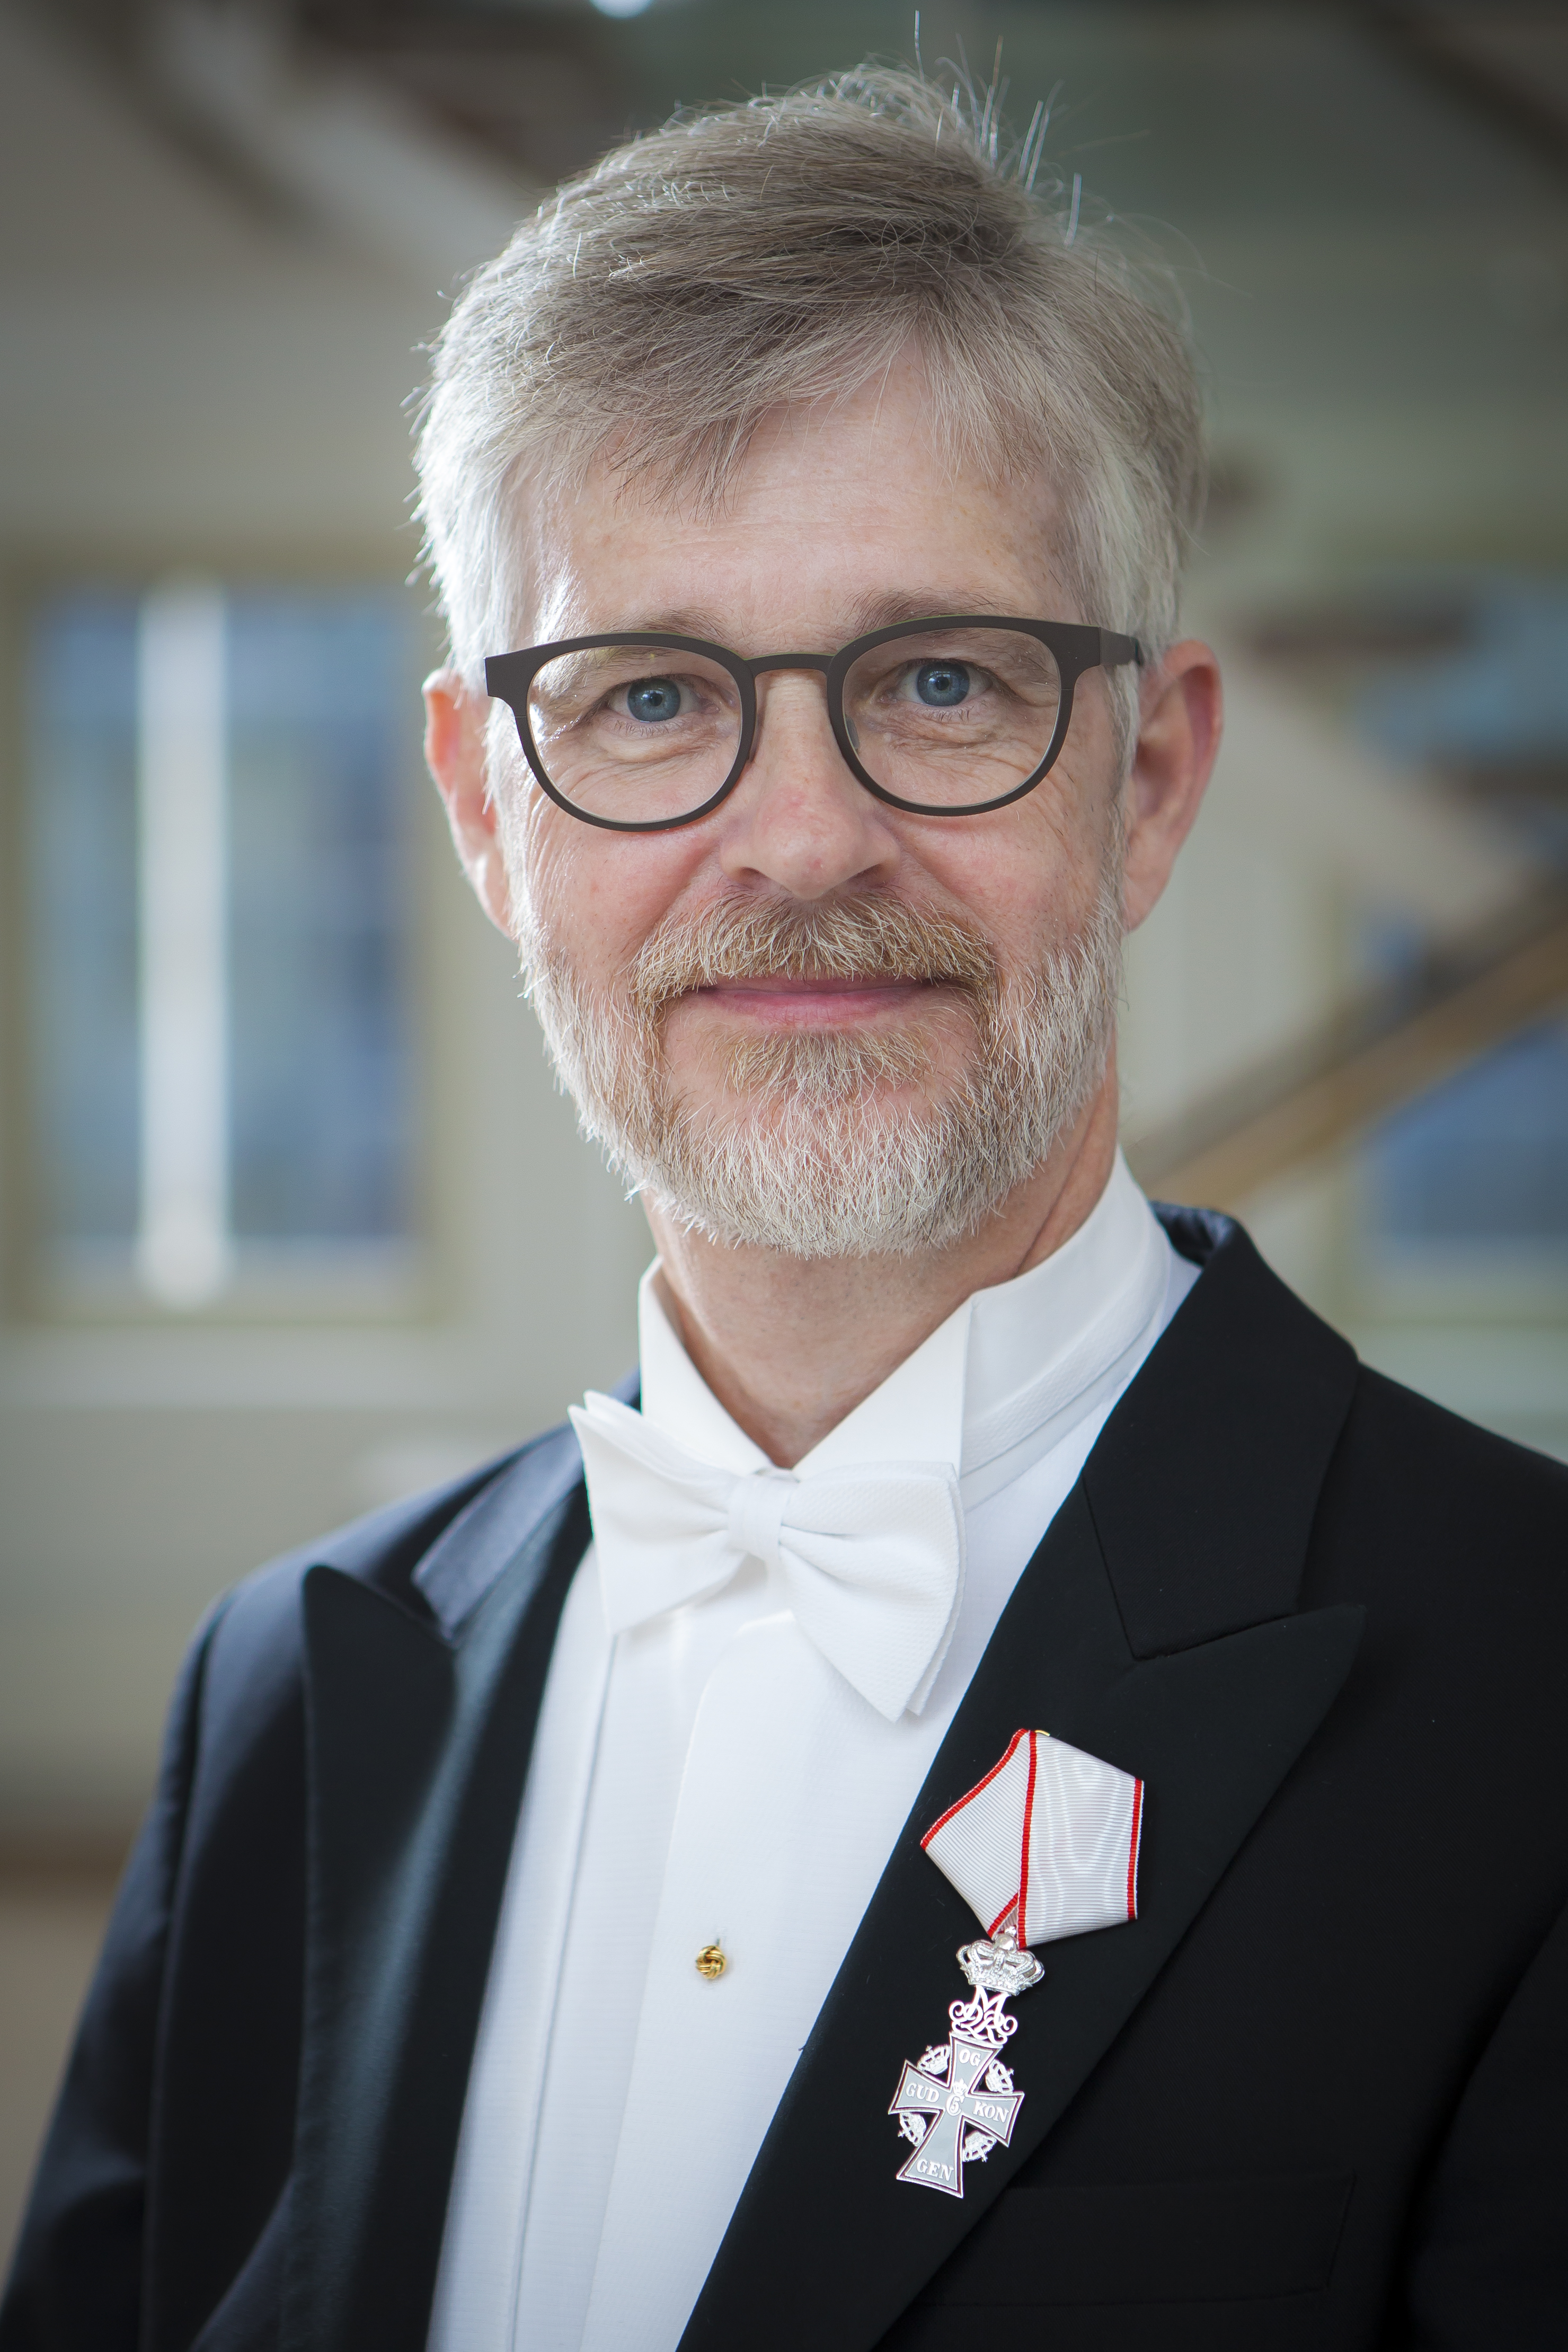
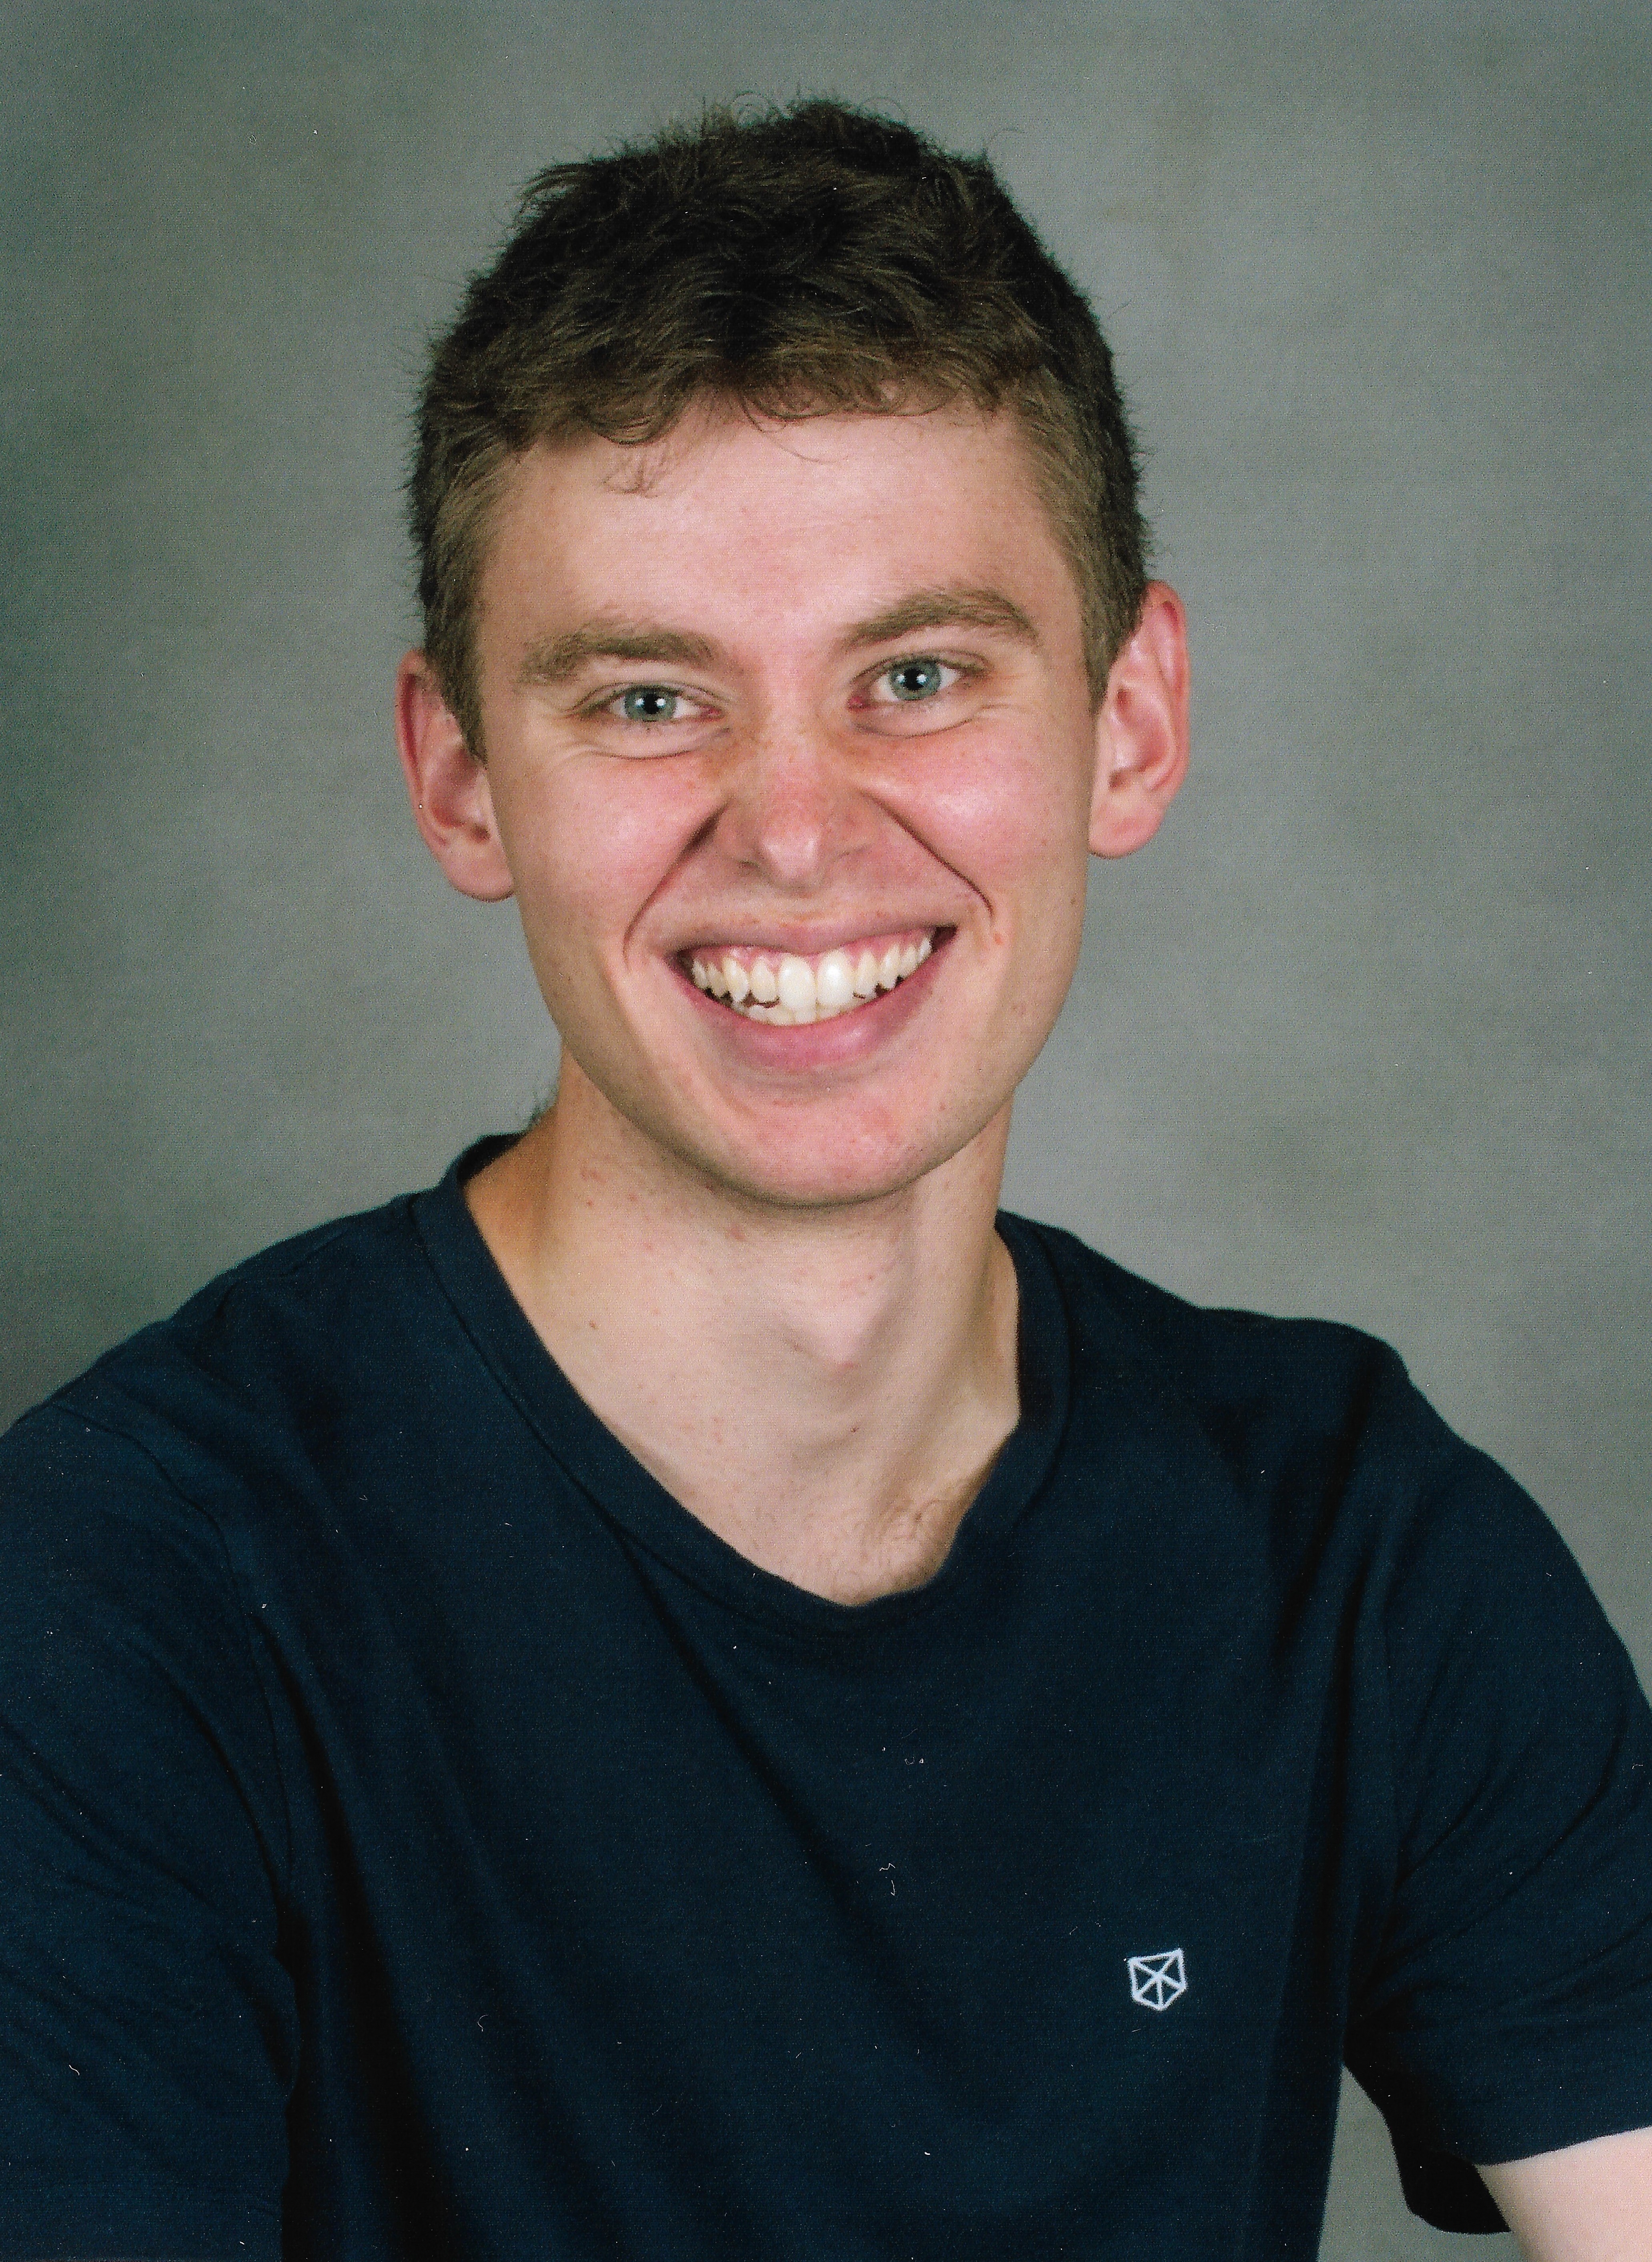
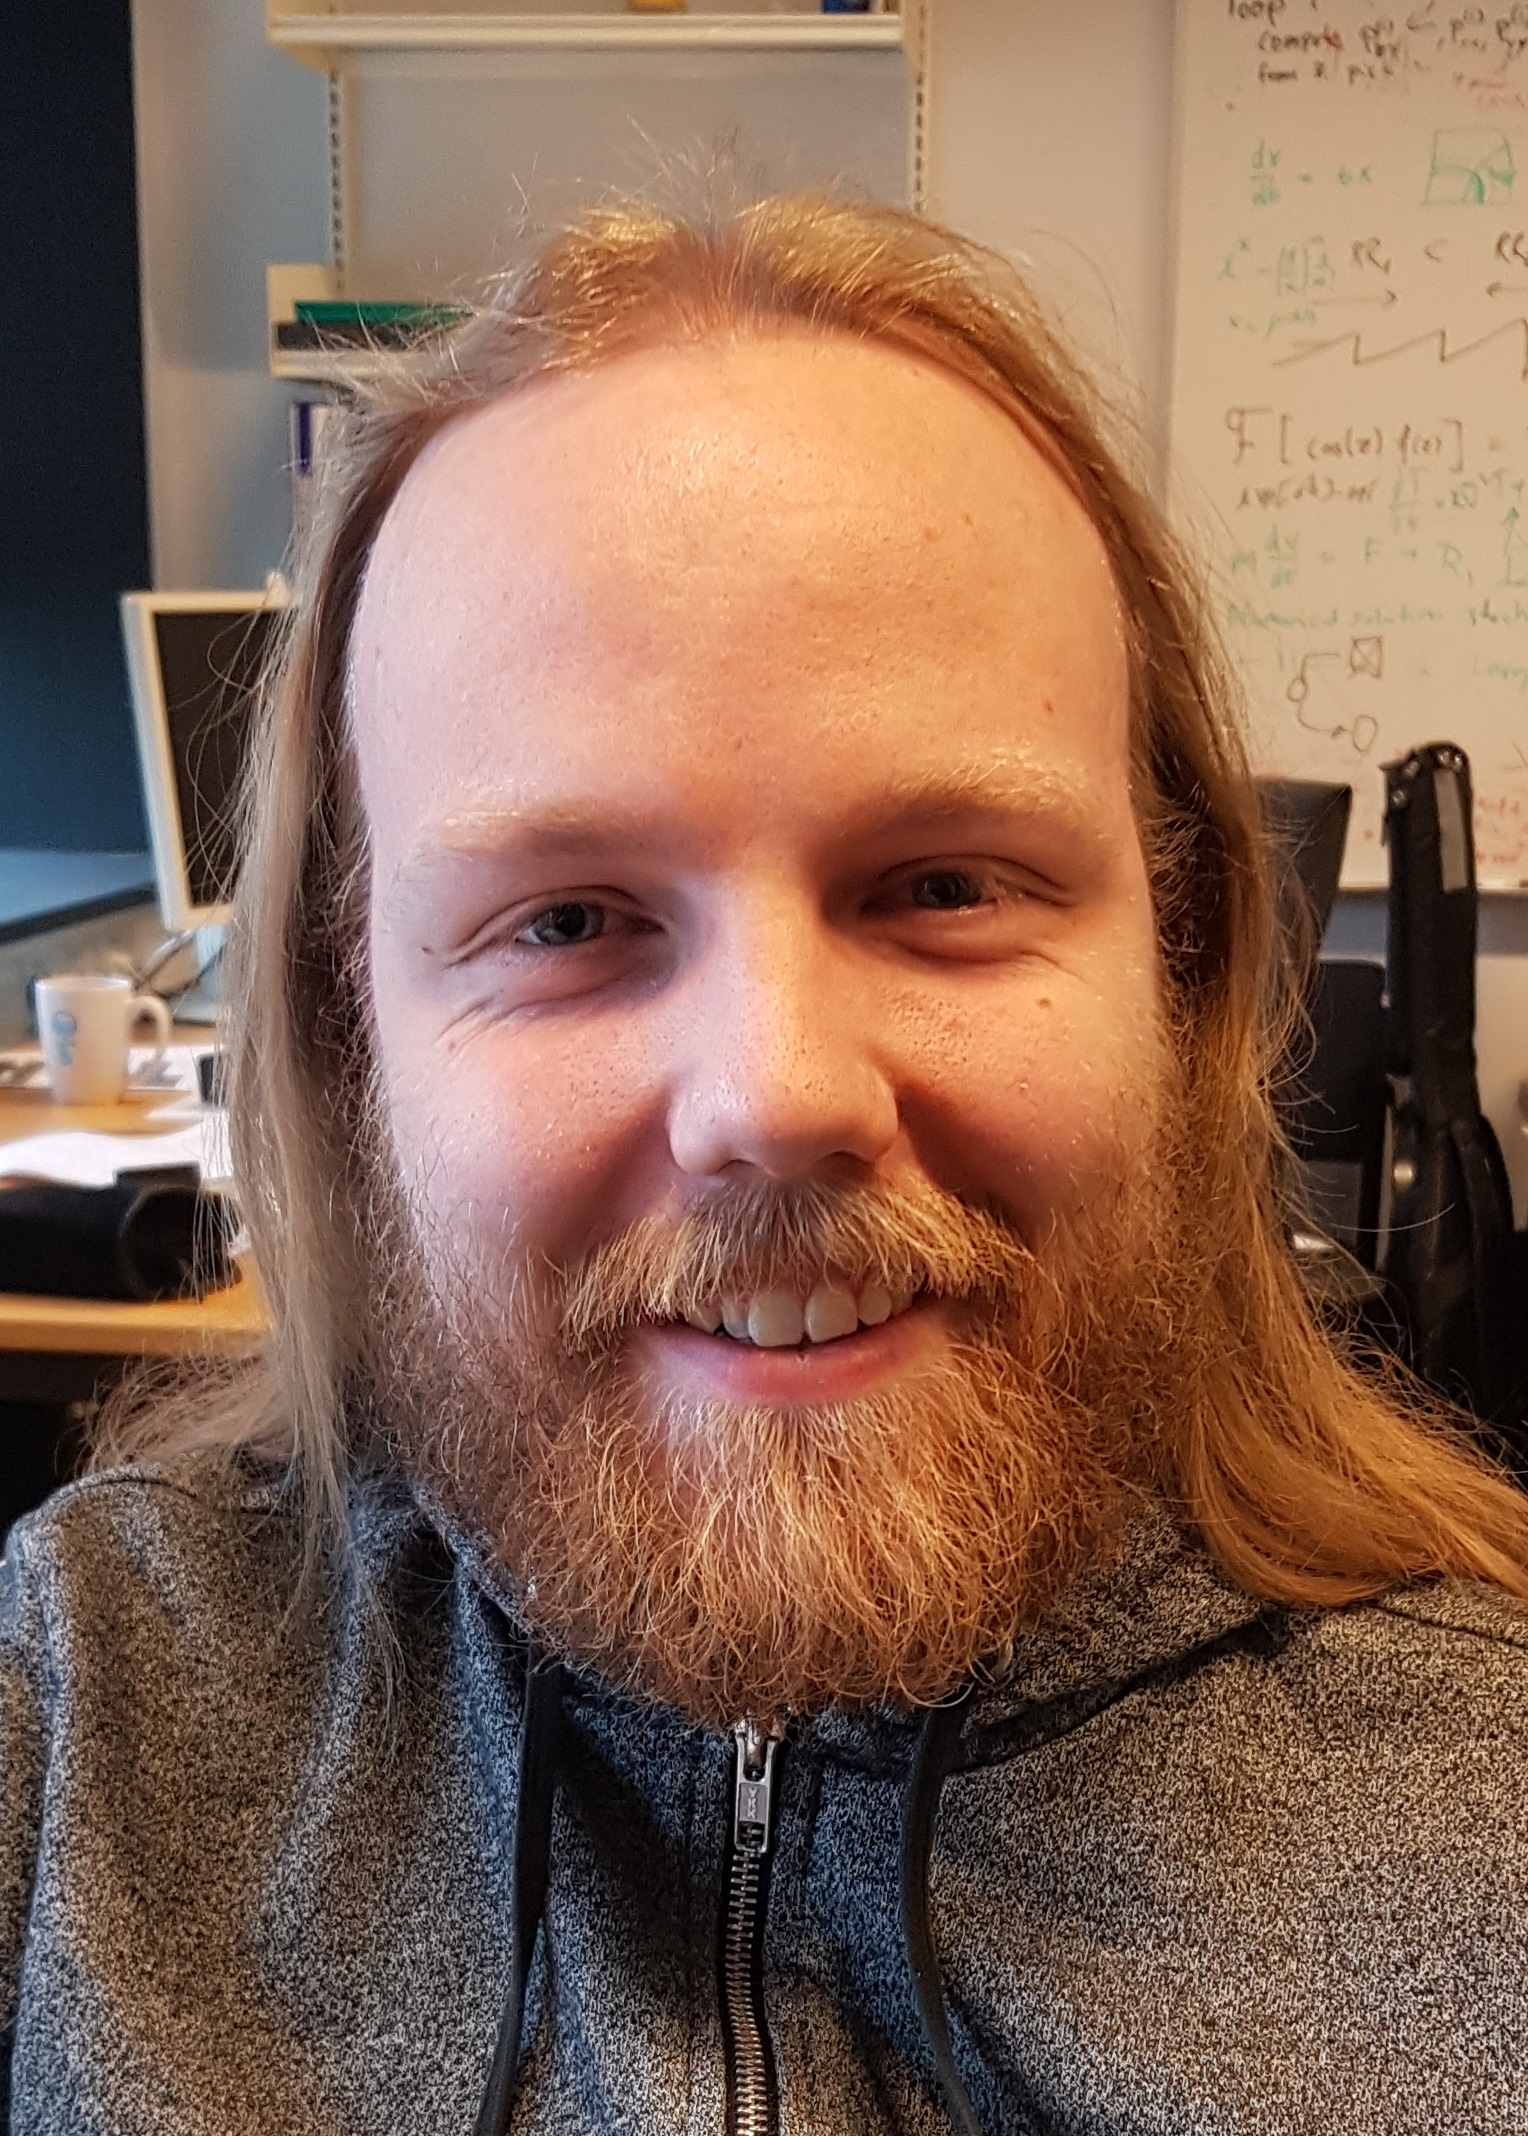
Link to journal View PDF View supplementary material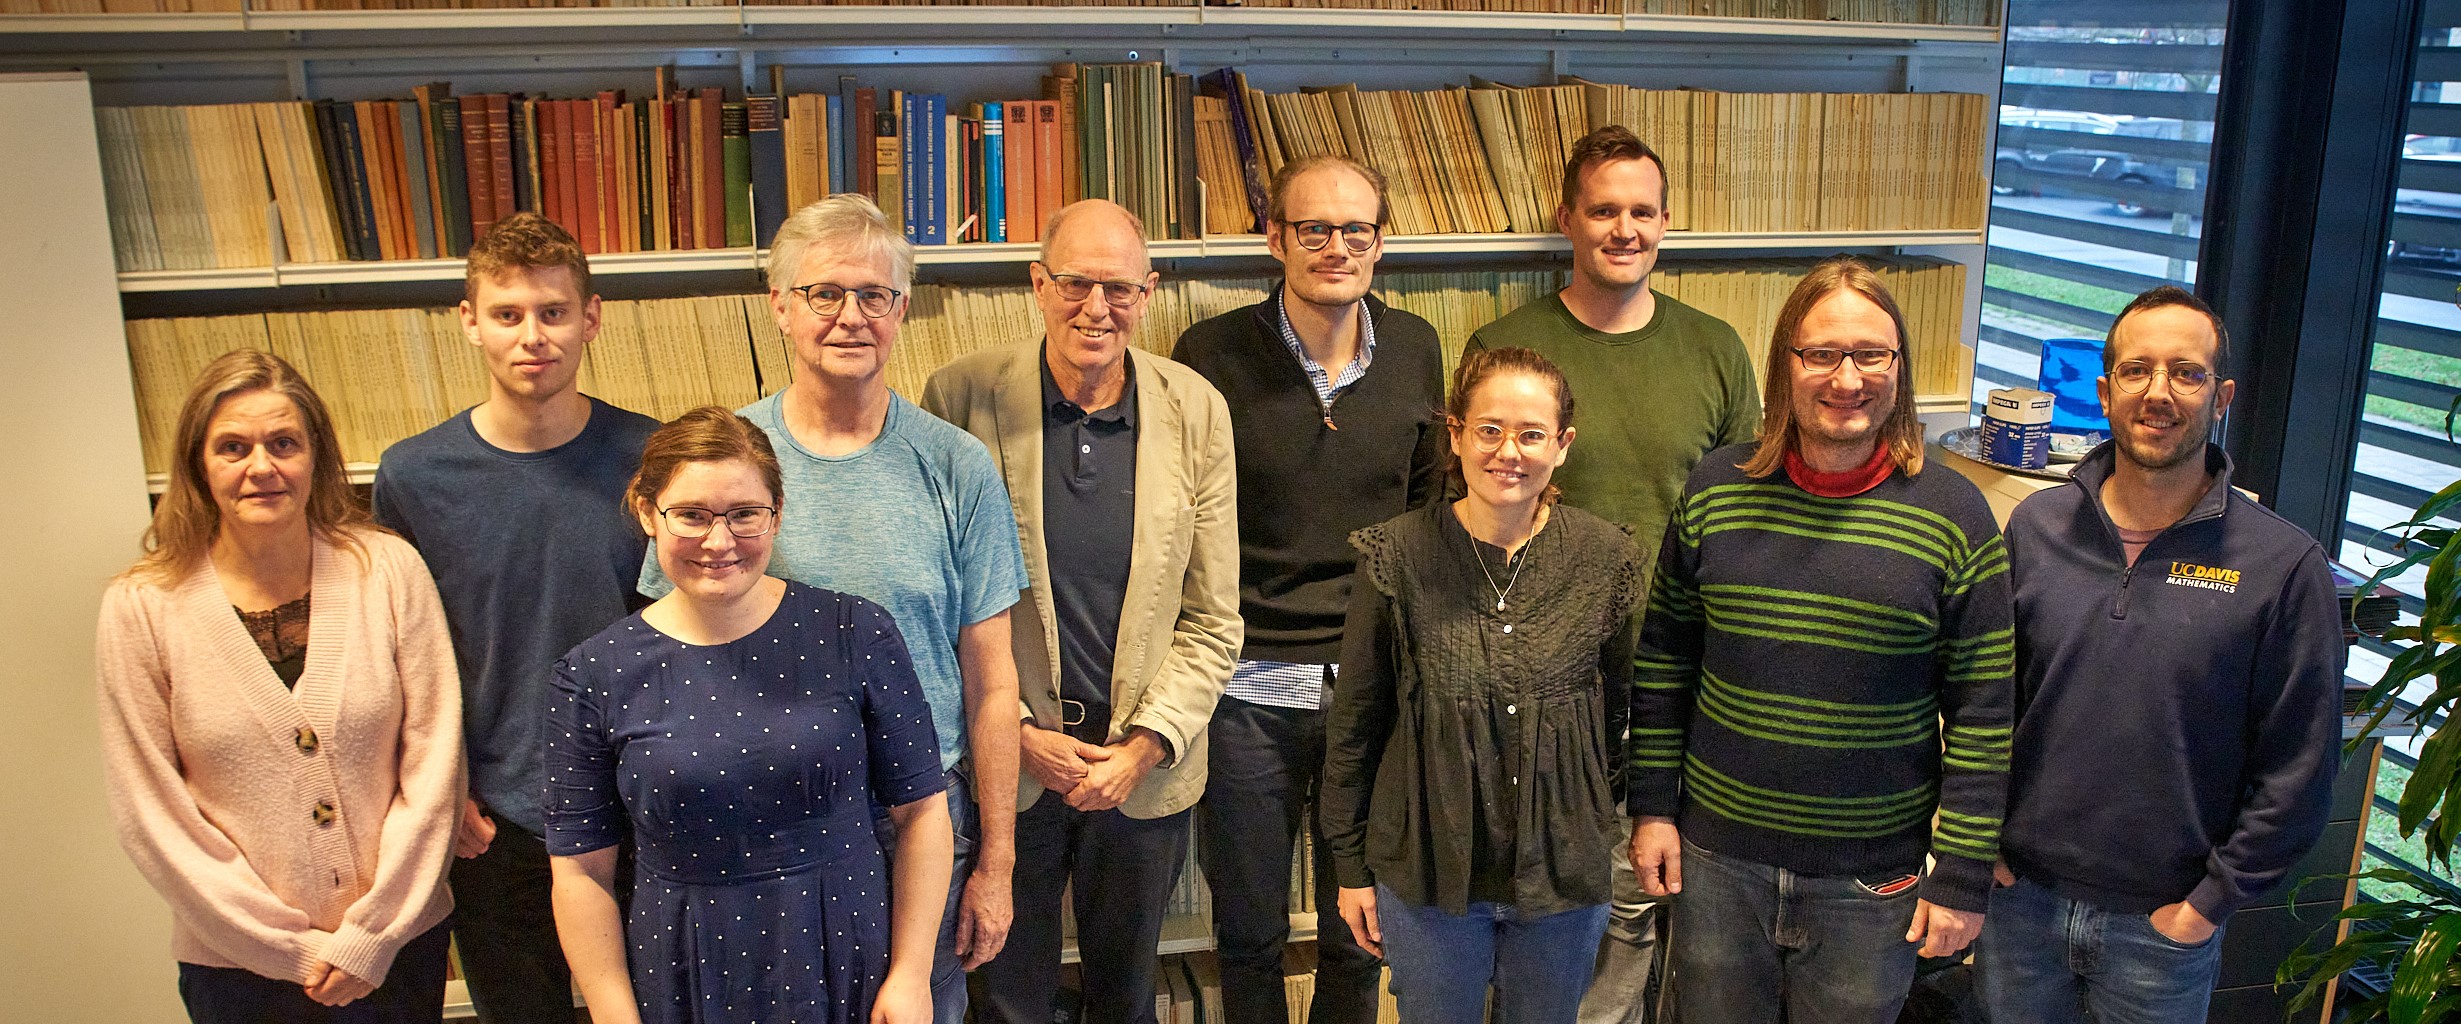 Members of the Cancitis group at RUC together with some of our Zealand University Hospital collaborators in November 2022. From left to right: Vibe Skov, Tobias Idor Boklund, Johanne Gudmand-Høyer, Johnny T. Ottesen, Hans C. Hasselbalch, Morten Kranker Larsen, Trine A. Knudsen, Morten Andersen, Thomas Stiehl, and Jordan Snyder.
Rasmus Kristoffer Pedersen
SlidesSpeakers: Rasmus Kristoffer Pedersen (Roskilde University), Thomas Stiehl (Heidelberg University), Jesper Troelsen (Roskilde University) and Peter Ashcroft (ETH Zurich)
Morten Andersen
Zamra Sajid
Rasmus Kristoffer Pedersen
Johnny T. Ottesen
Morten Andersen
Zamra Sajid
Rasmus Kristoffer Pedersen

Cohort of patients treated with either Hydroxyurea or Interferon-alpha animated over time from baseline (time of diagnoses) to 36 month after. First axis show percent changes in JAK2 allele burden and second axis shows the hematopoietic Biomarker Index (HBI), a weighted average of distance to normalized blood cell levels. Full remission corresponds to be at the lower left corner of the diagram. To calculate the HBI we determine the distance from the normal level for each of the three biomarkers (leucocyte count, platelet count and LDH). If a measurement lies above the normal level we calculate the distance to the upper limit of the normal level and if the measurement lies below the normal level we calculate the distance to the lower limit of the normal level. If a measurement falls within the normal level it adds zero to the HBI. To give each biomarker comparable weight we weigh the distances by the upper limit for the normal level of each biomarker. An example of the HBI calculation: The numbers indicate how far from the normal level each measurement is. The measurements which fall inside the normal levels do not contribute to the HBI. Taking the final measurement as an example the thrombocyte contribution is 264/390 ≈ 0.68, the leucocyte contribution is 4.0/8.8 ≈ 0.45 and the LDH contribution is 123/230 ≈ 0.53 and thus the HBI in this case is approximately 0.68 + 0.45 + 0.53 = 1.66. If the three cell counts were all in the normal range the HBI would be 0.
Problem-statements and examples for use for danish high-school students working on either SRP or SOP assignments.
View moreDanish article about our collaboration with clinicians.
View moreDanish article about blood cancers and our work.
View moreCollection of various material, intended for use in danish high-school in collaboration with Roskilde University.
View moreVideo (In danish)
Danish radio feature about mathematical modelling and blood cancers.
View moreMalthe Frøkjær-Rubbås
Magnus Skjold Frederiksen, Uffe Bundesen, Karl Skovfoged Nordentoft, Kenny Haslund Andersen, Max Thrane Nielsen and Poul Thrane
Stine G. Fohrmann, Lukas Rasocha, Jūlija Tumanovska, Julien Hirsch and Kata M. Riegels
Ilayda Dilara Pusat, Emira Havkic and Kimmie Britoft
Bjørn Dan Orfang Nielsen, Frederik Vedel Gantzel, Karl Skovfoged Nordentoft, Kenny Haslund Andersen, Max Thrane Nielsen and Poul Thrane
Daniel Vestma Norén, Emely Overby, Kimmie Schäfferling Britoft, Mads Jens Køie Nielsen, Mette Michelle Unterborg Alempiew and Michelle Vigant Nielsen
Mathis Brette Mortensen, Natalia Stati, Irida Gkouzou and Magnus Skjold Frederiksen
Jeannie Bøg Rasmussen, Maria Nørr and Mehmet Temizsoy
Mikkel Zielinski Ajslev, Hasan M. M. Osman and Stefan Bisgaard
Our main work concerns the Cancitis Model, as introduced in our 2017 PLOS One paper. Below is a schematic overview of the compartments of the model.

The corresponding system of ordinary differential equations is given as:
$$ \begin{align} \frac{dx_0}{dt} &= (r_x \phi_x s- a_x - d_{x0}) x_0 - r_m s x_0 \\
\frac{dx_1}{dt} &= a_x A_x x_0 - d_{x1} x_1 \\ \frac{dy_0}{dt} &= (r_y \phi_y - a_y - d_{y0}) y_0 + r_m s x_0 \\
\frac{dy_1}{dt} &= a_y A_y y_0 - d_{y1} y_1 \\
\frac{da}{dt} &= d_{x0} x_0 + d_{y0} y_0 + d_{x1} x_1 + d_{y1} y_1 -e_a a s\\
\frac{ds}{dt} &= r_s a - e_s s + I
\end{align} $$
where \( \phi_x (x_0,y_0) = \frac{1}{1+c_{xx}x_0 + c_{xy}y_0} \) and \( \phi_y (x_0,y_0) = \frac{1}{1+c_{yx}x_0 + c_{yy}y_0} \)